AbDiver - Documentation
Table of contents - please click on entries to scroll to the section.
About AbDiver
AbDiver is a tool to facilitate exploration of the naturally observed diversity of antibody frameworks and paratopes. The tools herein are designed to characterize mutational malleabilty for the benefit of rational antibody design and to facilitate identification of natural sequences close to your query (e.g. a therapeutic). To achieve these tasks we equip the users with tools to explore the diversity collected from 906,933,358 unique BCR sequences from 81 independent NGS/AIRR studies. The publicly available sequences that form the basis of this service were sourced as described previously; NB if the same sequence was found across multiple studies we count it as one, thus if we were to take such redundacy into account, the factual number of sequences/reads is approximately 2 billion.
We mapped three use cases that allow the users to achieve this task:
- Positional frequency profiling of query sequences to indicate positional malleability and discrepancies with respect to natural distribution of reference allele in a specific organism.
- Identification of sequence-similar V-region sequences to indicate if a given query (e.g. therapeutic) has been observed naturally. This was previously shown to be the case with many therapeutics with high identity matches to naturally sourced sequences, this tool faciltiates such endeavors.
- Identification of clonotypes based on CDR3/germline combinations, to facilitate identifying distant, CDR3-related BCRs.
V-region profile
You can submit an amino acid sequence of the variable region of either heavy or light chain to perform positional V-region profiling. We pre-calculated the positional diversity of a range of allelic combinations (V+J alleles) as well as gene combinations (V+J genes). The two methods of annotation (gene/allele) are designed to offer different levels of granularity, and take into account caveats in IG-gene annotation. The values were calculated across all our NGS studies to emphasize commonalities in positional frequencies that persist despite different numbers of individuals, sequencing techniques, disease states etc.
At input, you can choose whether you would like us to find the closest profile to your query or whether you would like to contrast it against organism specific-profile, human or mouse. Additionally you can specify whether you would like to perform the comparison on the gene level (more data but risk of mixing alleles) or allele level (less data and risk of allelic misannotation). The statistics are presented per IMGT position and the following information is given:
| Attribute | Description |
|---|---|
| Rank | The rank of the query amino acid proportion across independent NGS studies. The most frequently observed AA has the rank of one. |
| Proportion | The average proportion of the given amino acid across independent NGS studies. |
| Entropy | The entropy of the given position across independent NGS studies. |
| Query Amino Acid | The amino acids and IMGT numbering of the query. |
| IMGT position | The numerical IMGT position. |
| Region | Indicator of the framework or CDR regions. |
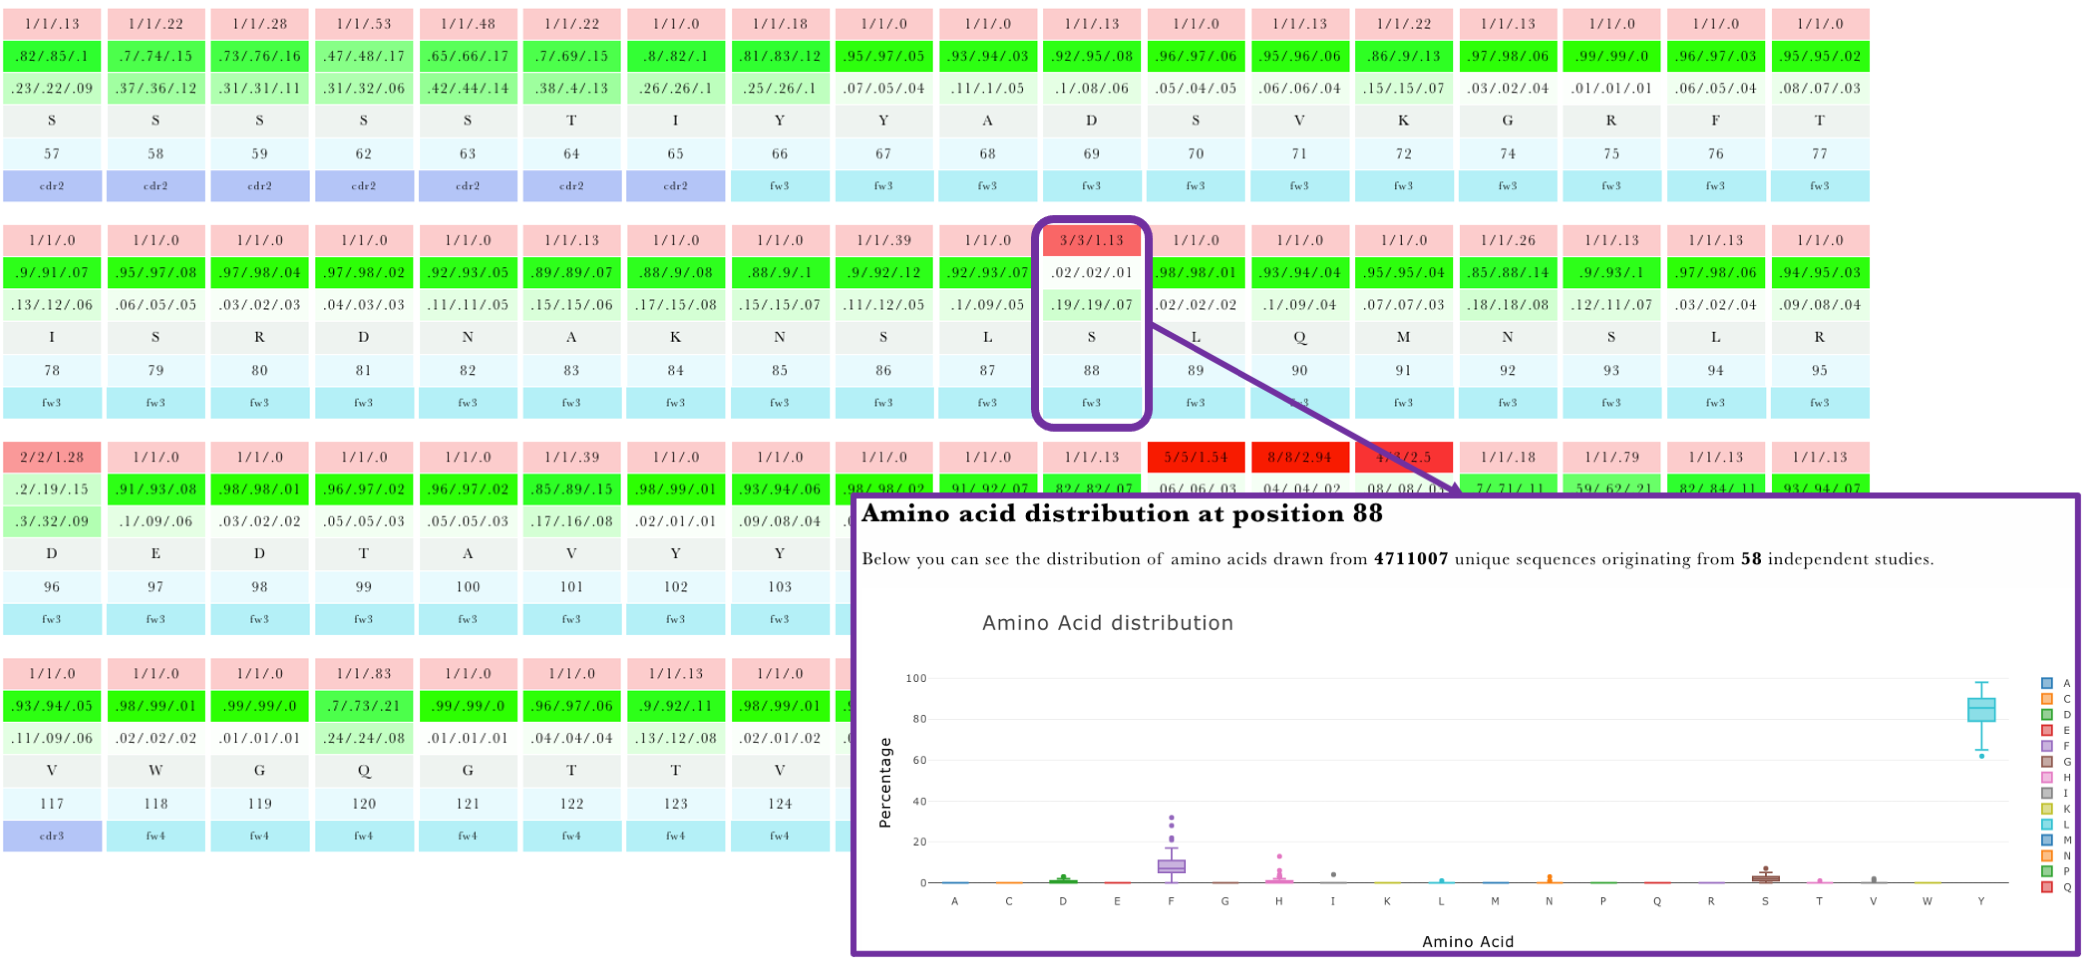
The results are presented using an overview and detail tables. The overview table will report whether there are any positions in the framework region disagreeing with the observed NGS amino acid distribution (Figure 1). If there are no disagreements with the NGS distribution the table will not be displayed. Detailed annotations for each position are given in an interactive table with an entry for each IMGT position (Figure 2). Clicking on any position will yield the aggregate statistics for the positional amino acid frequency at the given position. The error bars are aggregates of frequencies across independent NGS studies. This information can offer insight into 1) alternative mutational choices at a given position 2) consistencies across studies in amino acid frequencies and 3) indicate positions in your query that are not in agreement with reference distribution.
Figure 1.AbDiver variable region profiling overview table.

Figure 2 AbDiver variable region profiling details table.

V-region search
You can submit a sequence to check if sequence similar V-region was observed in next-generation sequencing repertoires. The high-quality closest matches will be selected on the basis of CDRs an framework identity by virtue of IMGT alignment to reflect the antibody-specific nature of the search. At input, you can select whether you wish to find the closest matches altogether, or whether you would like to look for closest matches in either human or mouse sequences or choose the genes yourself. The closest matches are presented in three forms:
| Visualization | Description |
|---|---|
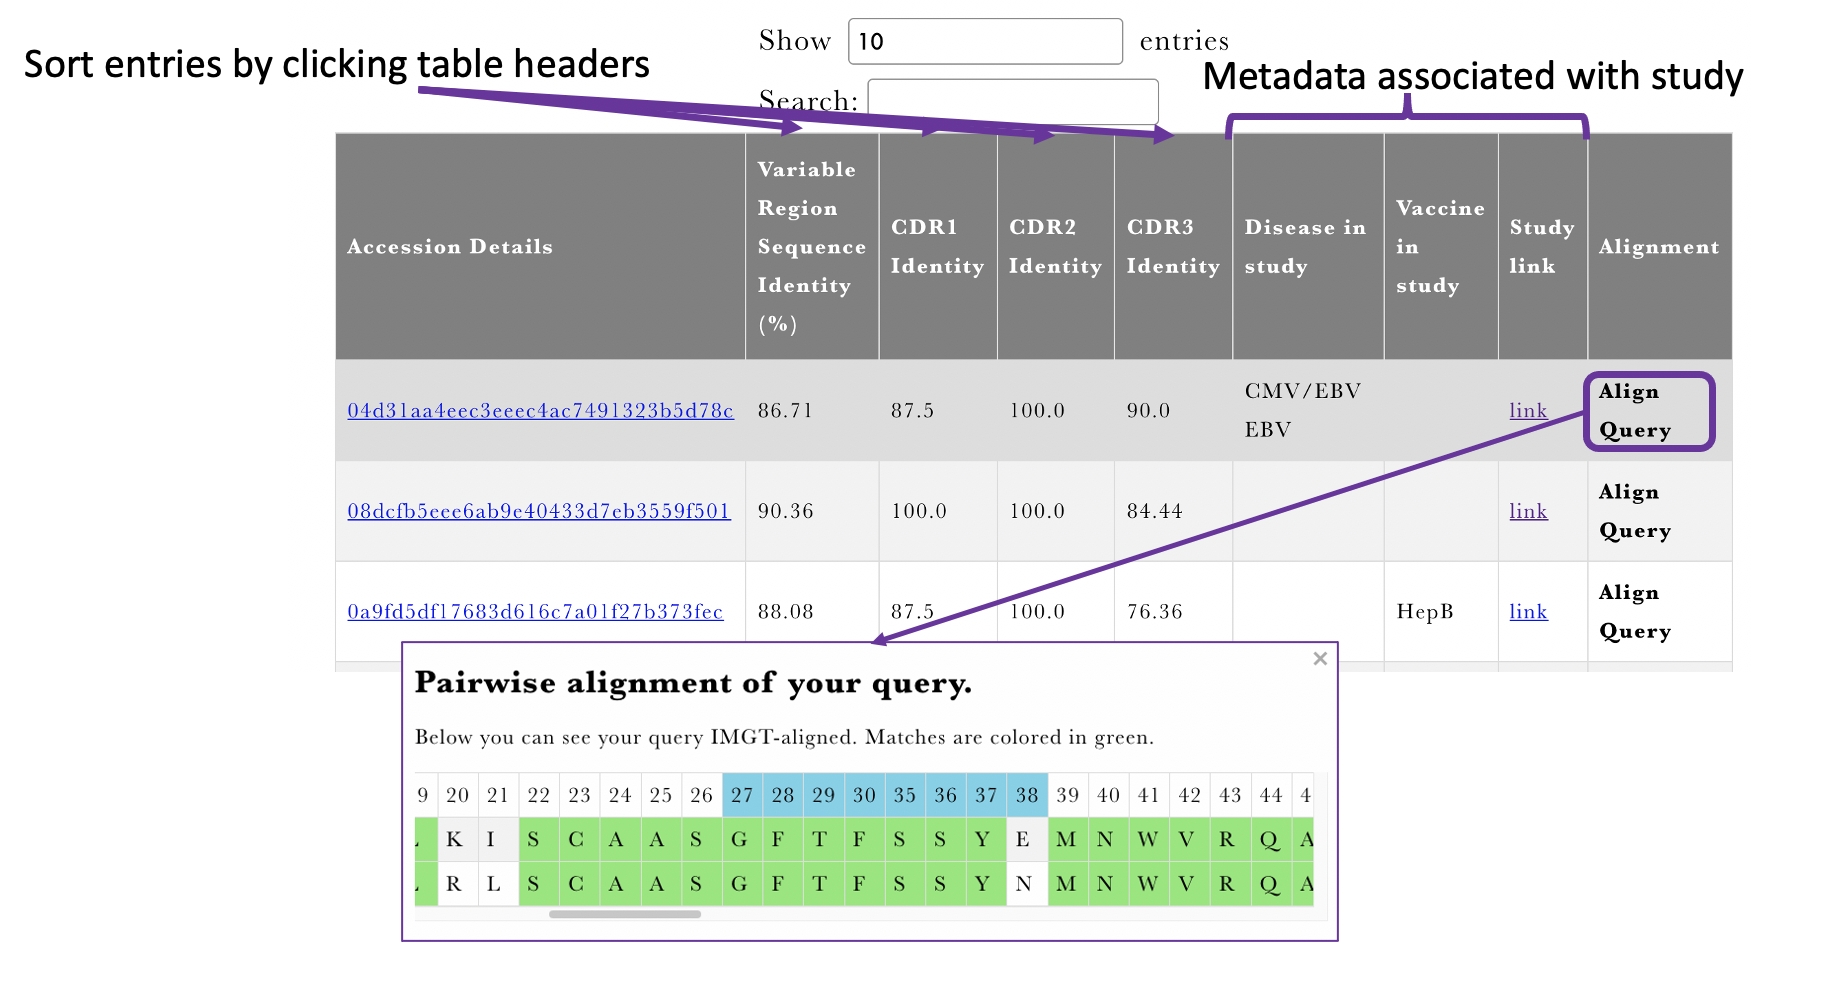
| Overview table (Figure 3) | The metadata associated with the studies where the matches were found. |
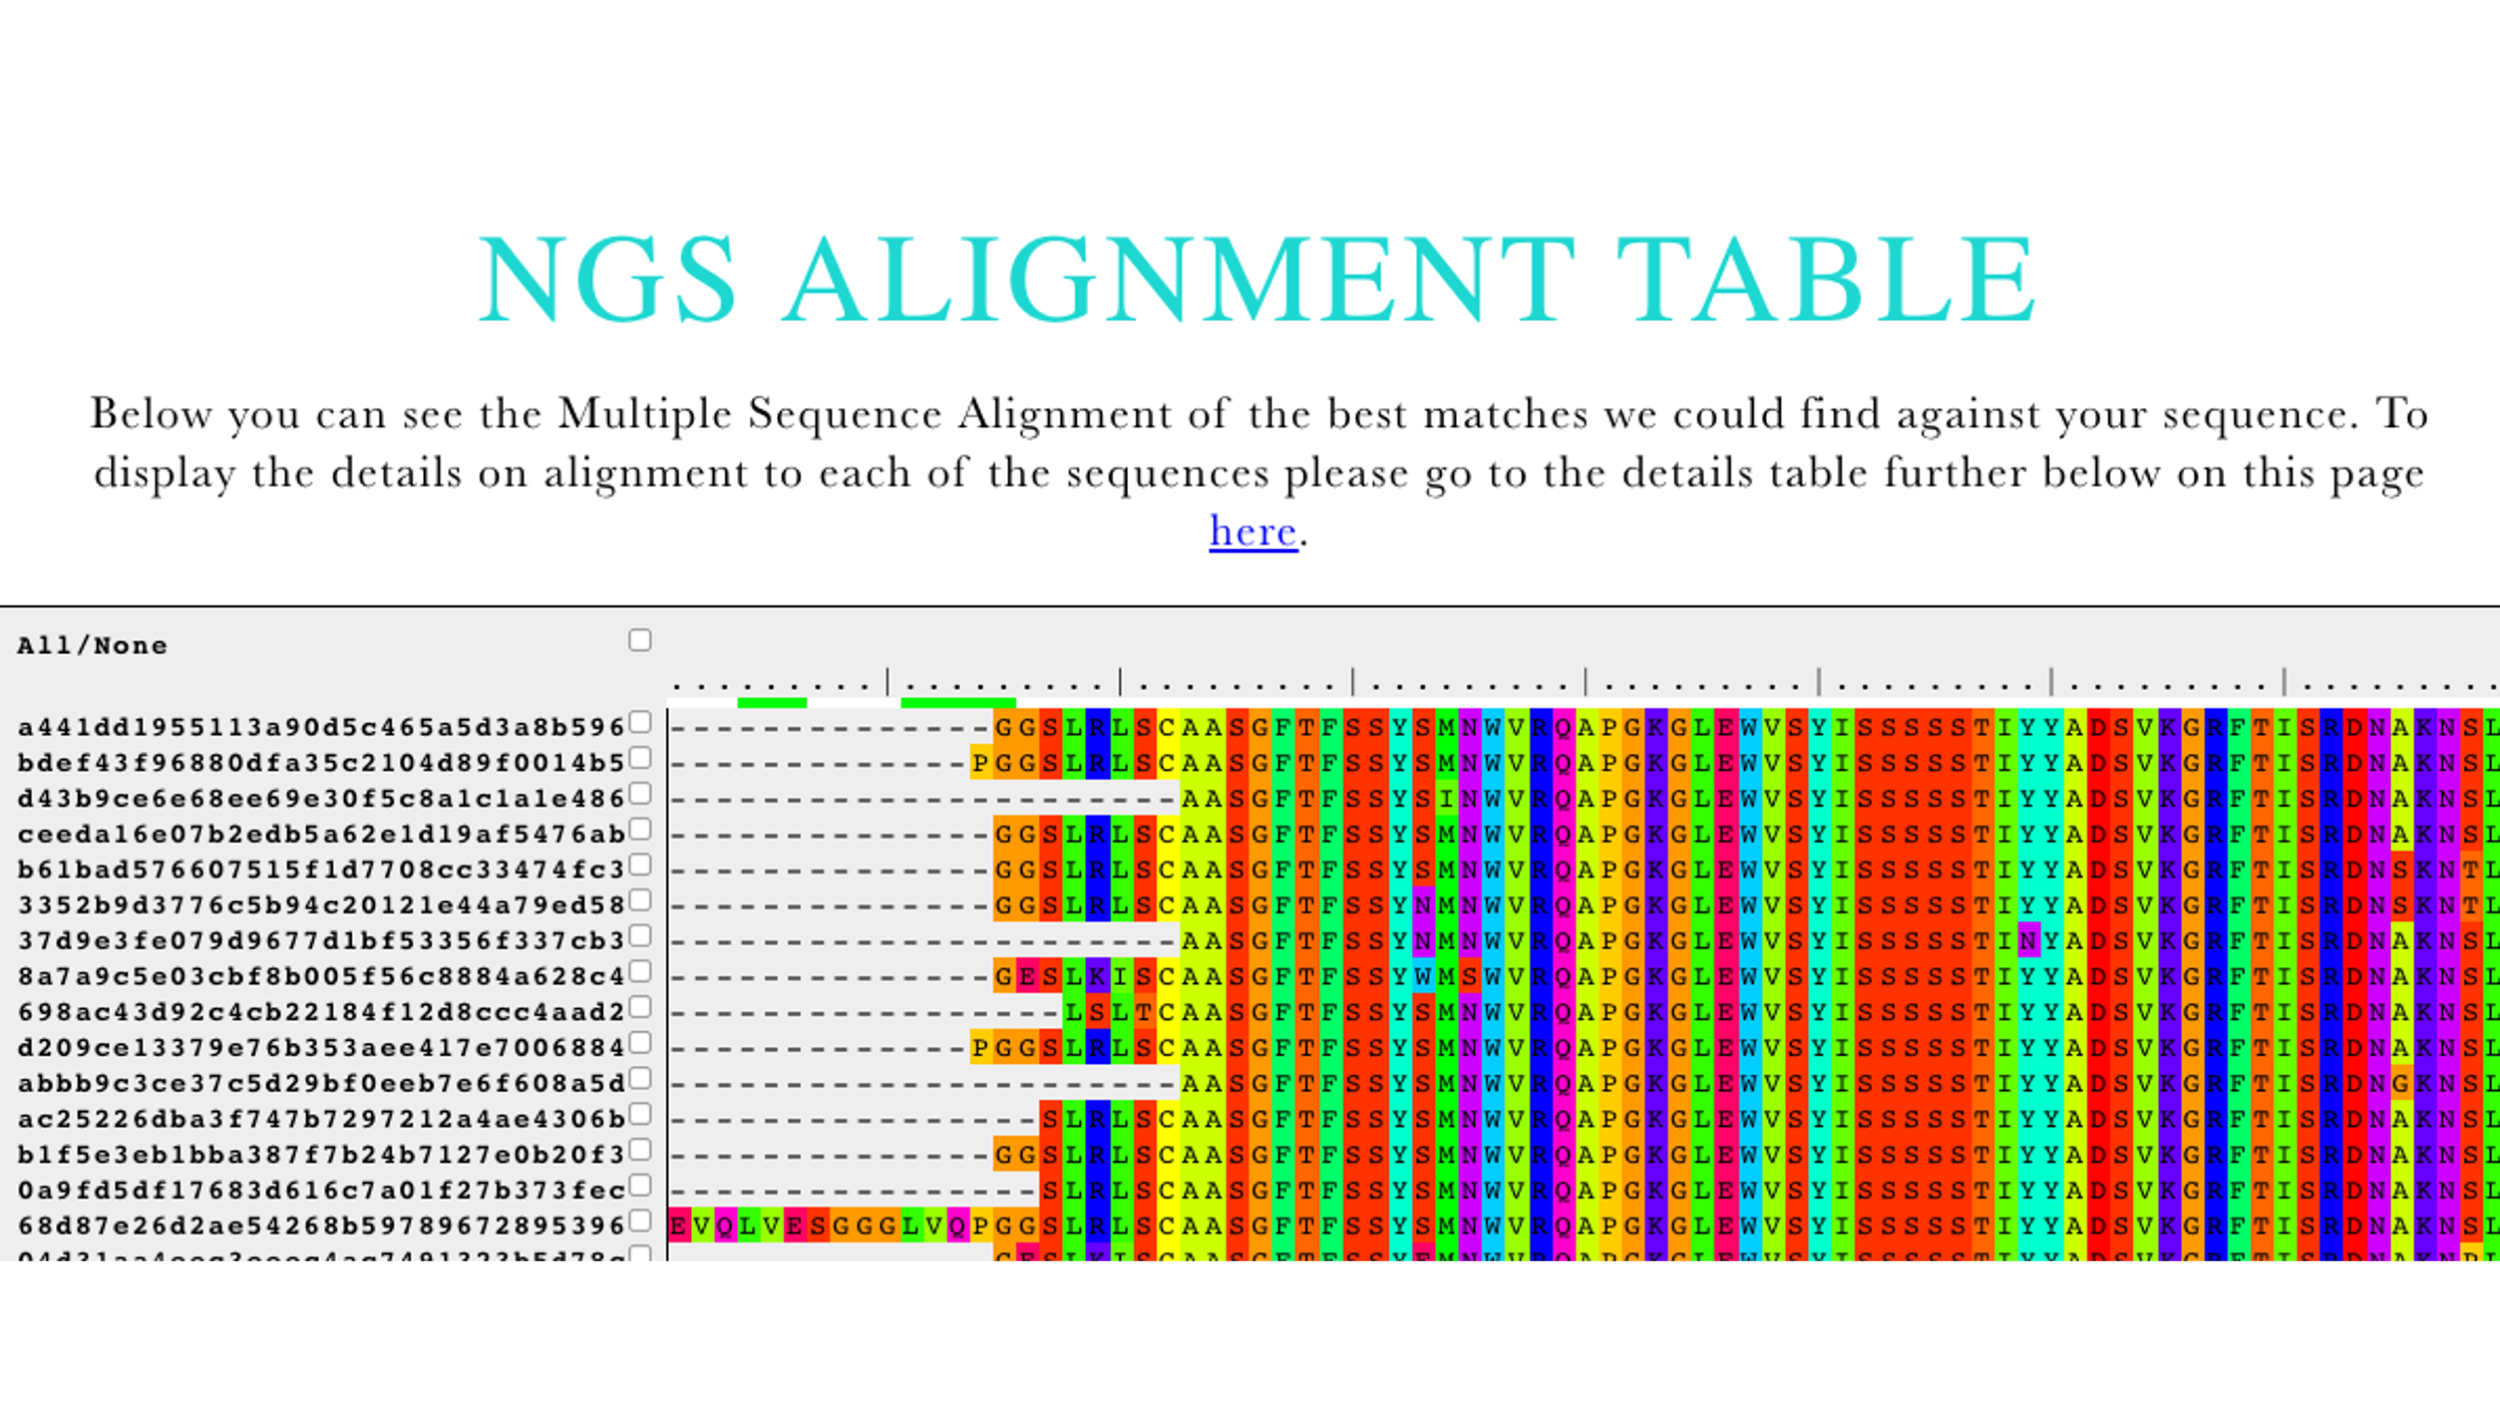
| Multiple Sequence Alignment (Figure 4) | All the results are IMGT aligned and displayed using JSAV, which is a javascript-based utility facilitating interaction with web-based MSAs. For convenience, the query sequence is placed in the top row. |
| Pairwise alignments (Figure 5) | The pairwise alignments are displayed using an interactive table. The table can be sorted the entire sequence or specific CDR identity. The pairwise alignment to the query can be displayed upon clicking on |
Figure 3 Overview of the metadata where matches were found.

Figure 4 Multiple Sequence Alignment output of AbDiver.

Figure 5 Pairwise Sequence Alignment output of AbDiver.

CDR3/Clone search
We make it possible to identify sequences only using the most variable portion of an antibody, the CDR3 sequence in what is typically referred to as
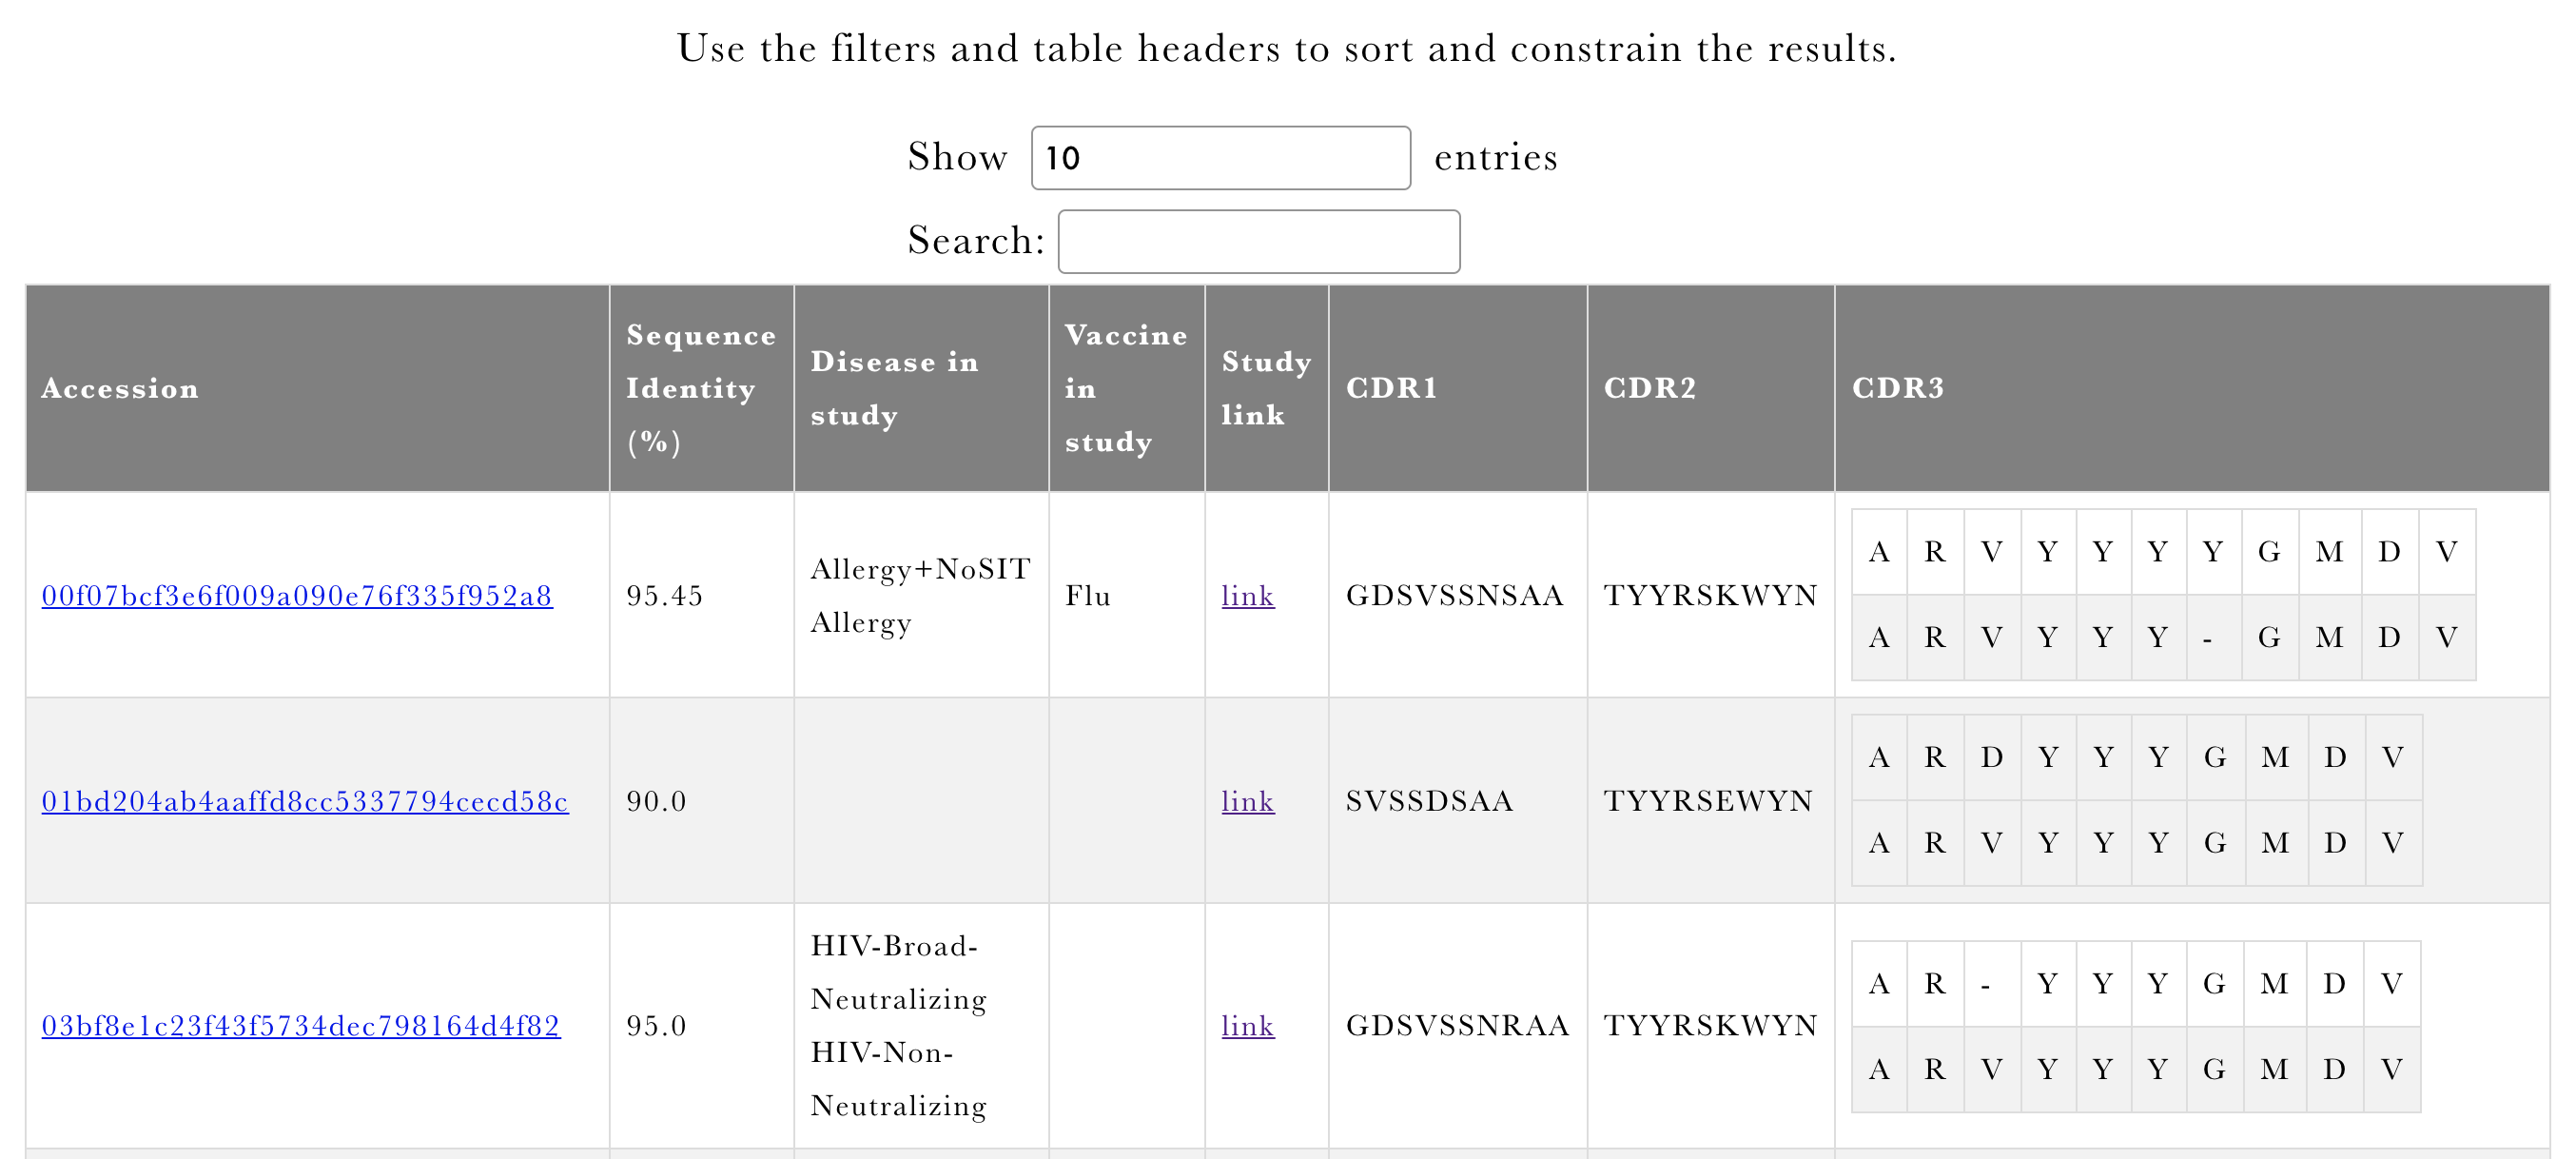
If we identify any matches, they will be presented using the overview table reporting the leading motifs associated with the studies where we identified the matches (Figure 6), and an interactive table (Figure 7). User will be able to see the identity to the CDR3 together with pairwise alignment together with the CDR1 & CDR2 from the original sequence. The original sequence contributing the CDR3 can be traced back to the publication that it comes from by clicking on the sequence accession.
Figure 6 CDR3 or Clonotype overview output of AbDiver.

Figure 7 CDR3 or clonotype sequence output of AbDiver.

Terms of Use
AbDiver is free for all to use. We ask the users to use the system reasonably as excessive programmatic querying of the data can result with service disruption to other users - for such endeavors we rather suggest to get in touch with us contact@naturalantibody.com
Contact
AbDiver was developed by NaturalAntibody. If you have any questions regarding the contents of this service, found errors, have suggestions for improvements or similar, please get in touch at contact@naturalantibody.com.
